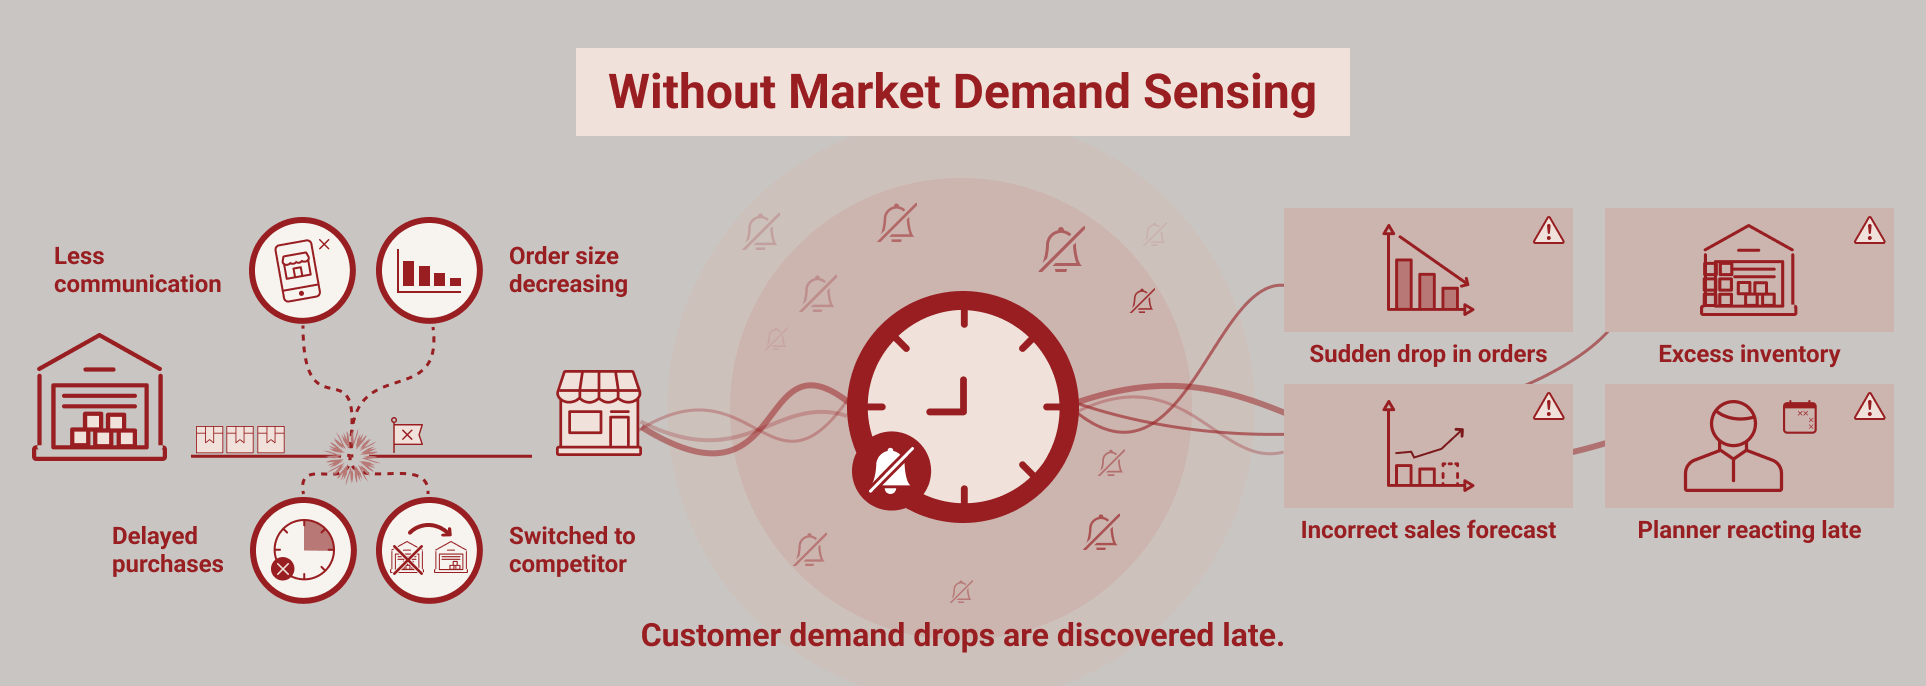
Customer behavior rarely changes abruptly. Order patterns shift gradually. Volumes drift. Engagement weakens.

These signals often appear long before any formal change in contracts. If they go unnoticed, planning continues based on assumptions that are no longer valid.

When Contracts and Reality Diverge

Contracts define expected demand, but actual behavior often tells a different story. Order frequency declines. Volume commitments are not fully met.

Communication slows.
Without early visibility, this gap grows, leading to excess inventory, misaligned production, and inaccurate forecasts.

market demand sensing

A Predictive View of Customer Behavior

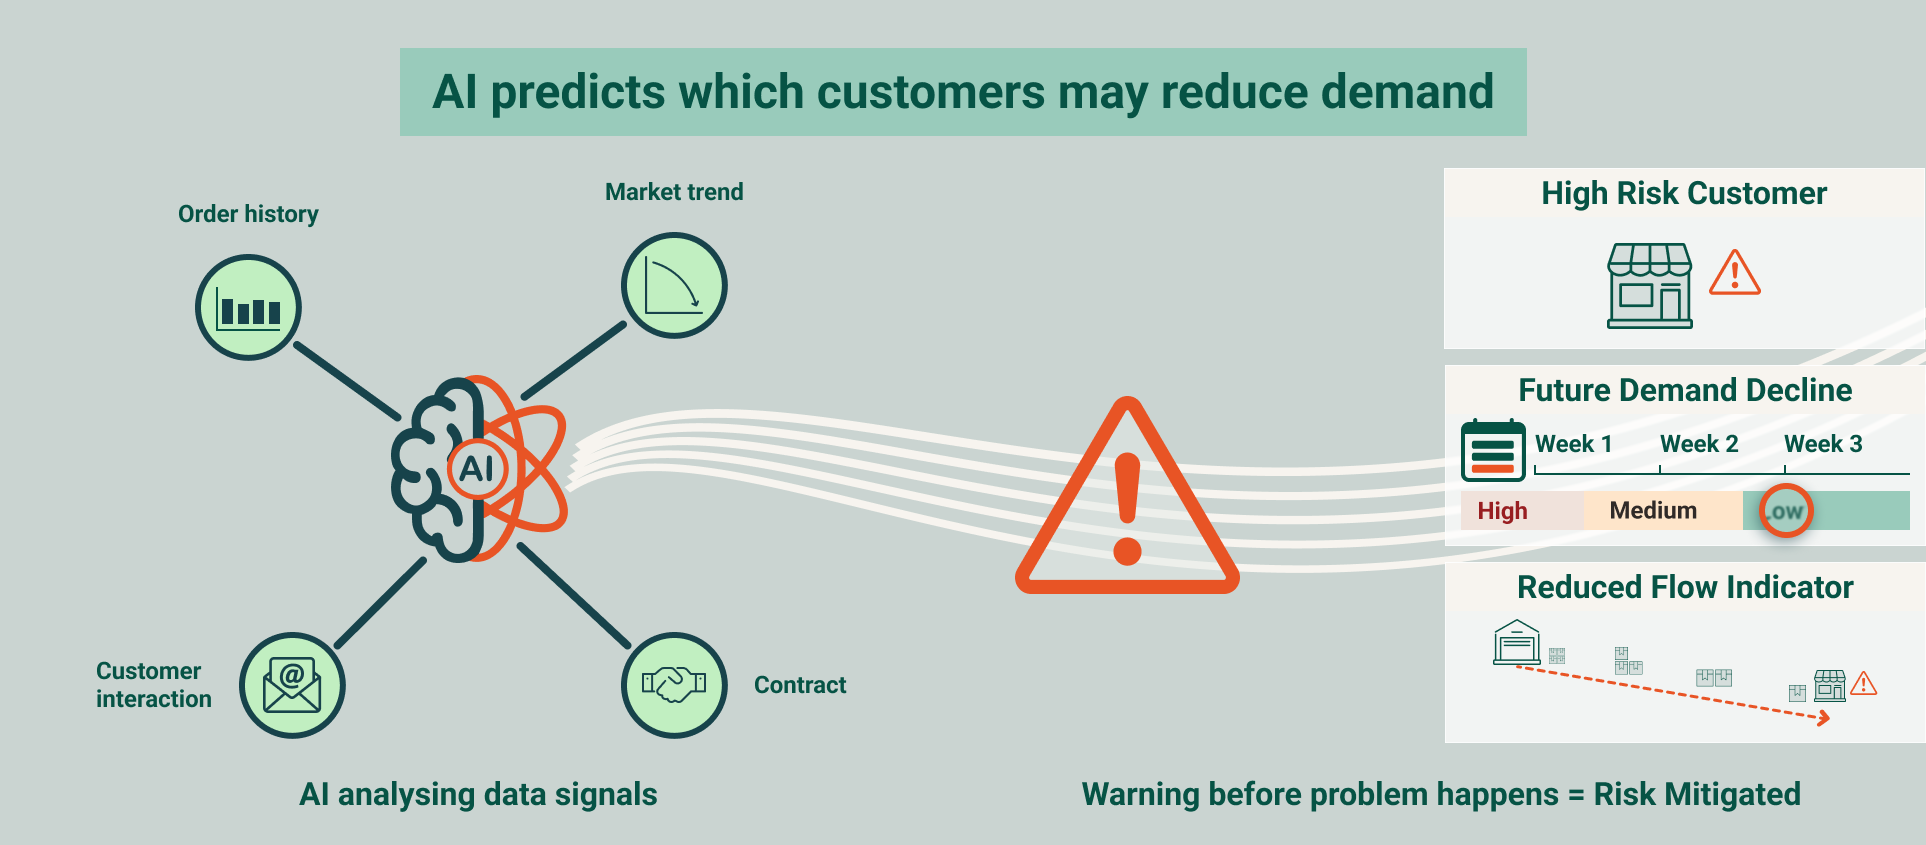
Predictive demand sensing analyzes how customers behave over time, identifying patterns that signal strengthening, stable, or declining demand.

It combines transactional and behavioral signals to estimate what is likely to happen next.

Key indicators include:

  • Changes in order frequency
  • Gaps between committed and actual volumes
  • Slower response or engagement patterns
  • External signals influencing purchasing behavior

This provides a forward-looking perspective on demand stability.

market demand sensing

Turning Insight into Better Decisions

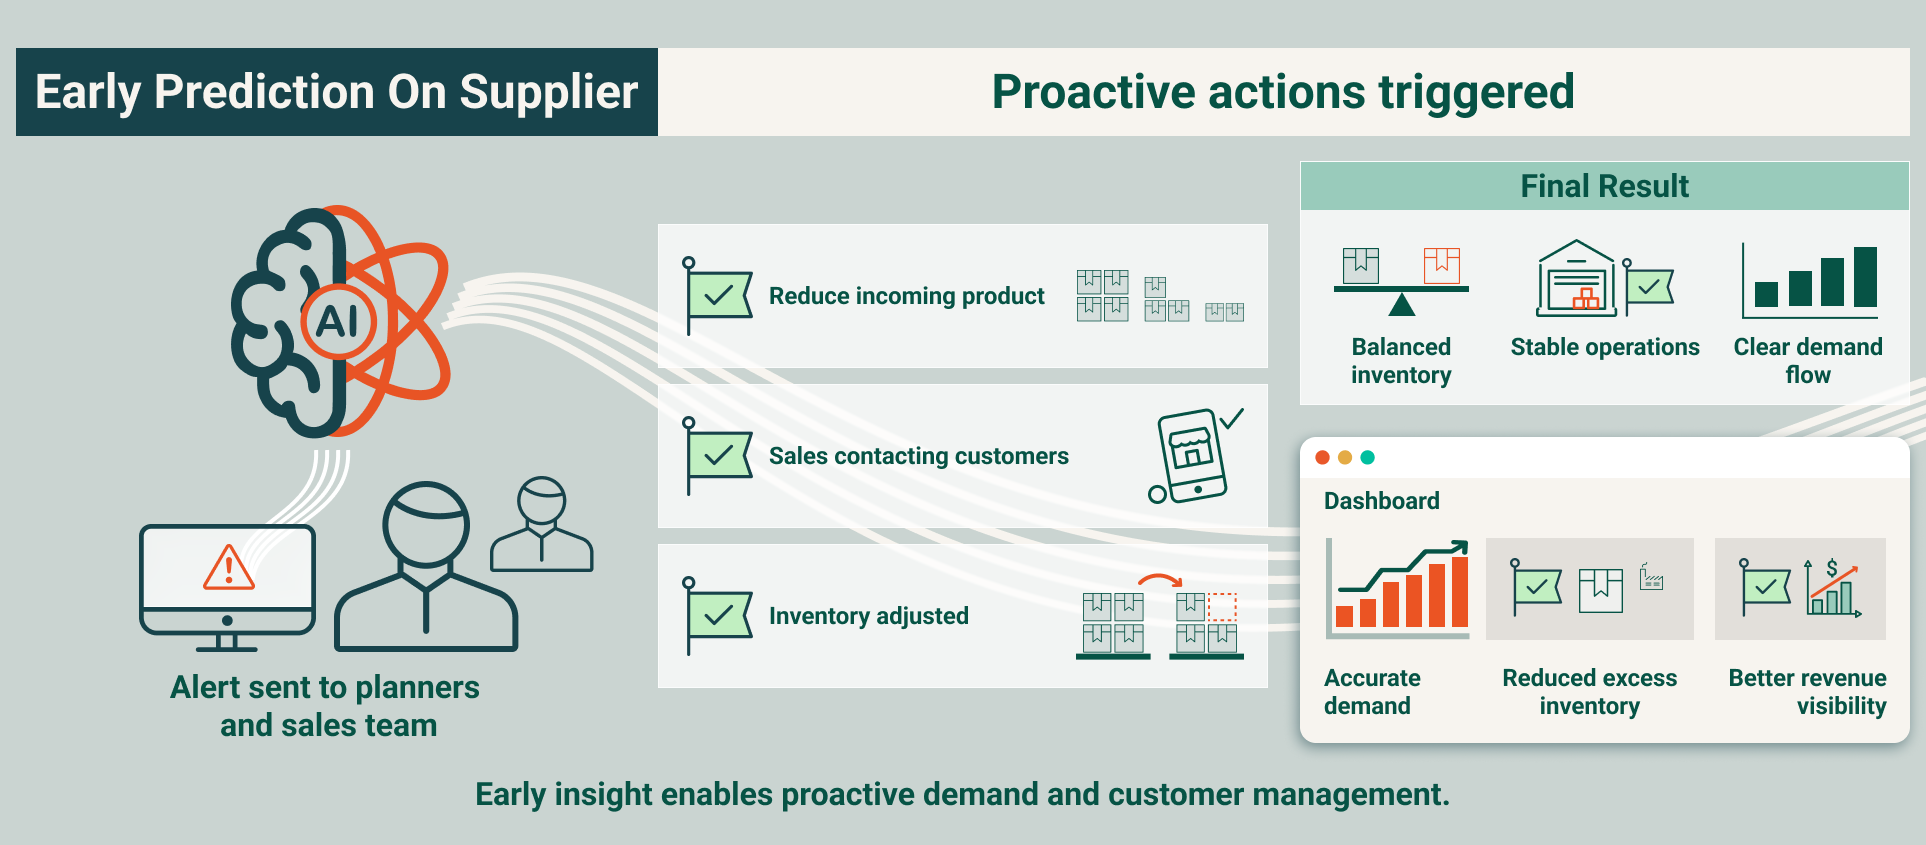
With clearer visibility, planning becomes more realistic. Forecasts reflect likely demand instead of historical assumptions, and production capacity can be aligned with more stable demand streams. Commercial teams gain time to engage at-risk customers before declines accelerate.

Aligning the Entire Value Chain

When demand signals are shared across functions, decisions become more coordinated. Procurement avoids overcommitting, inventory aligns with actual needs, and customer communication becomes more accurate. This reduces operational noise and improves overall stability.

market demand sensing

Measurable Impact

  • More reliable demand planning
  • Earlier identification of at-risk customers
  • Better alignment between inventory and actual demand
  • Improved capacity and resource utilization

A Capability That Sharpens Over Time

As more behavioral data is captured, the system continuously improves its ability to detect subtle demand shifts.

Over time, it becomes a critical input for both planning accuracy and customer relationship management.

Want to learn more?

With 20 + years of experience and more than 1,000 successful projects, Optilon helps companies design supply chains that work and keep improving.

Book a meeting with a supply chain expert to explore how predictive demand sensing can improve forecast accuracy, reduce demand uncertainty, and strengthen customer insights.
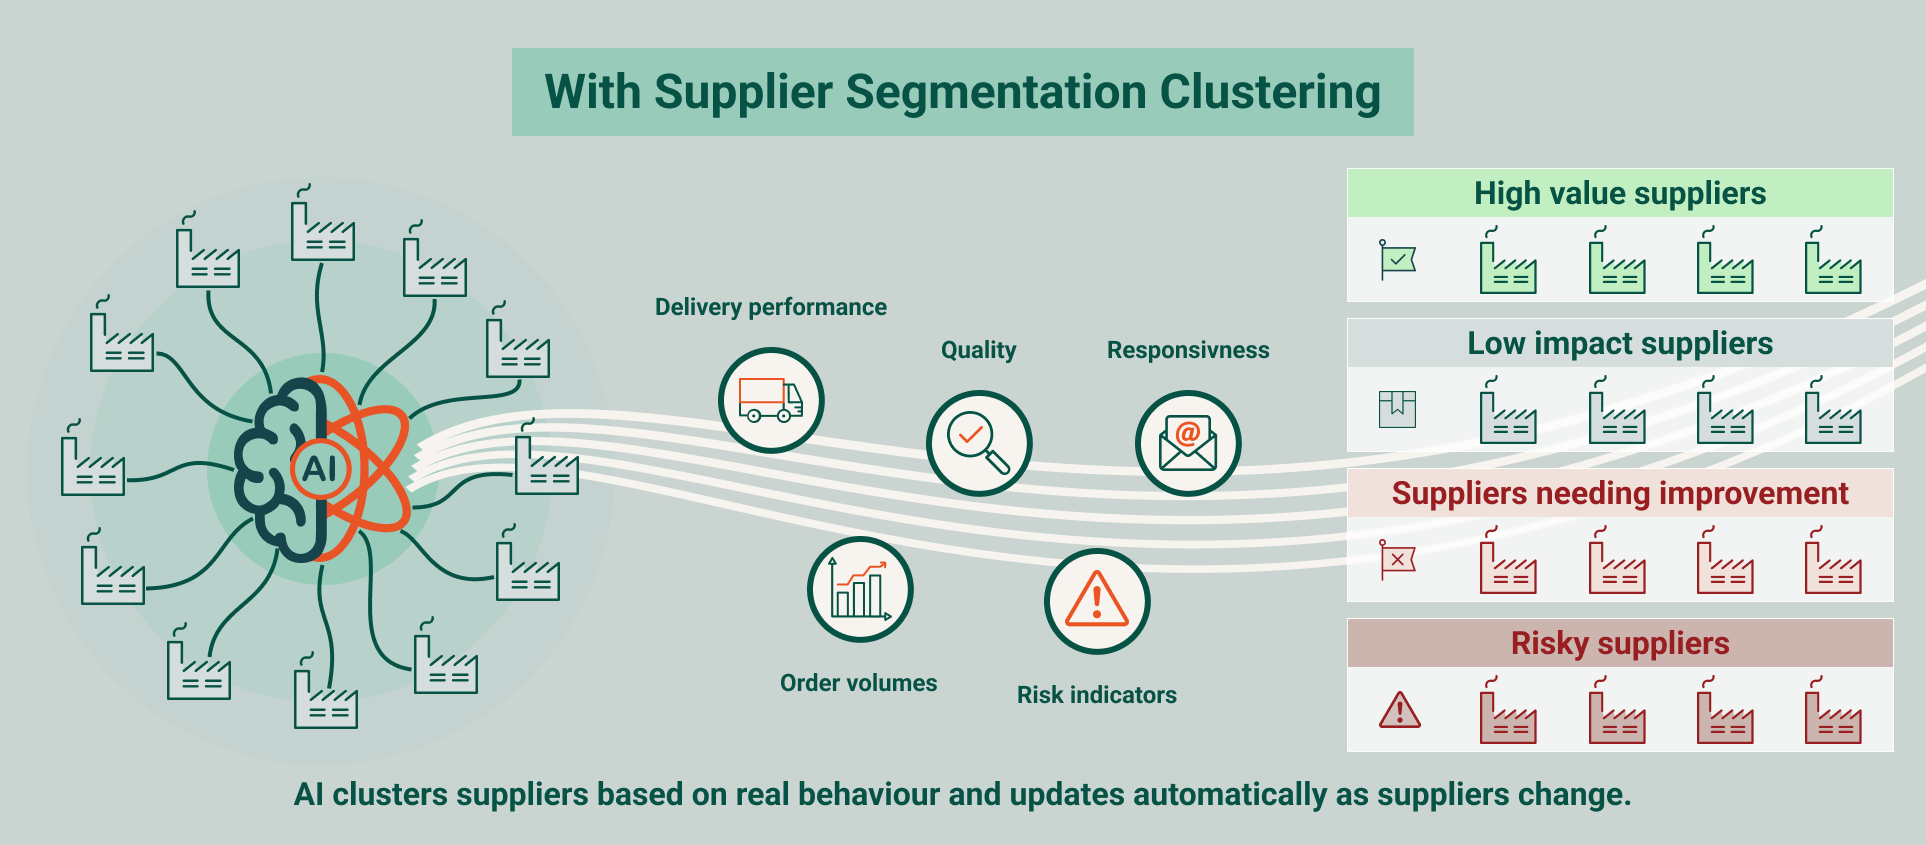
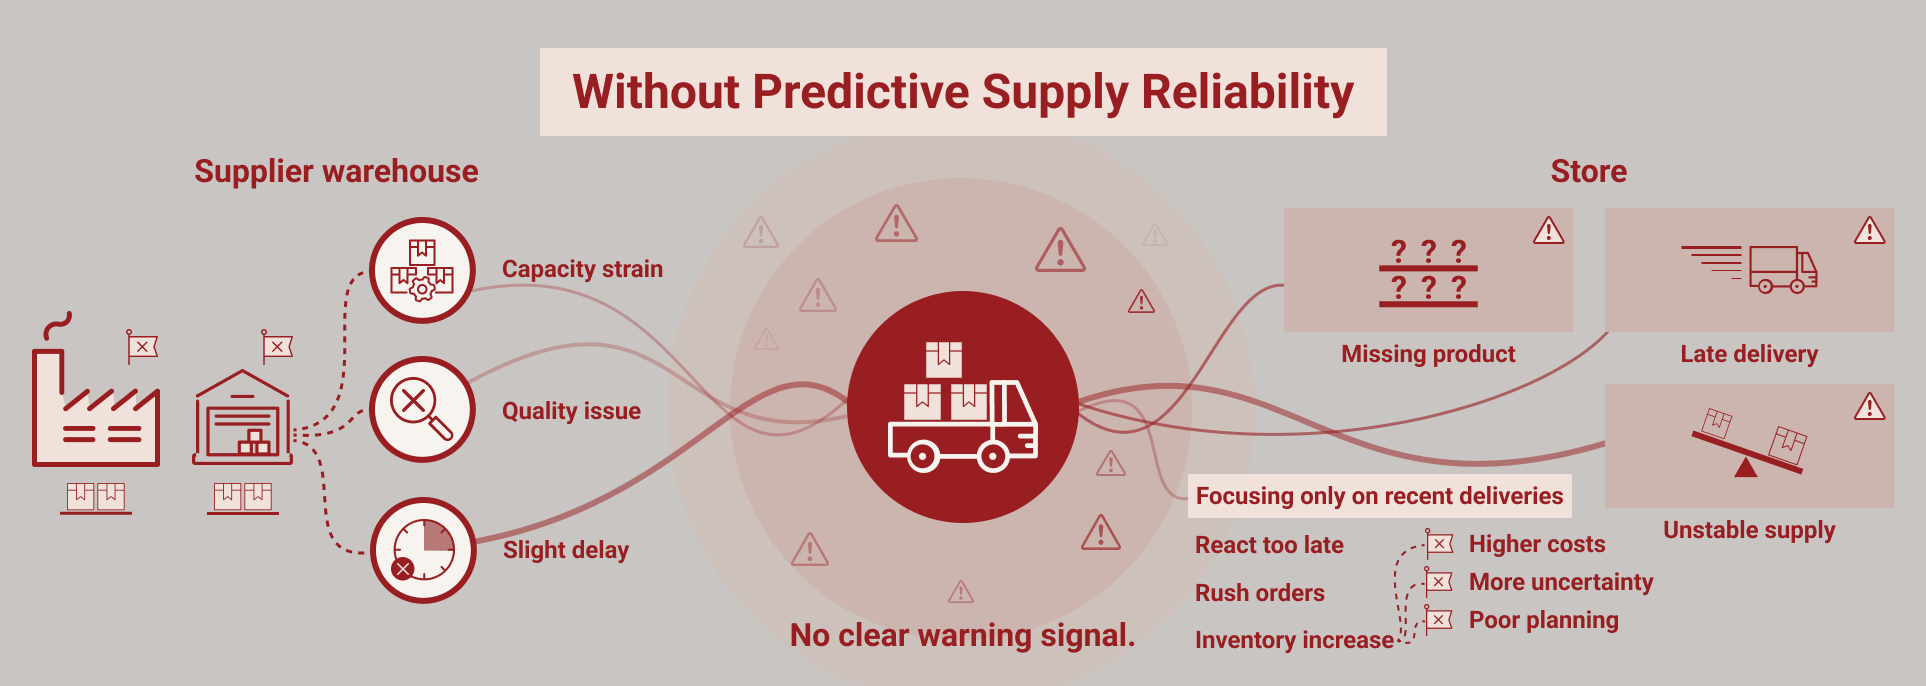
Supplier issues rarely appear overnight. Delivery precision weakens gradually. Lead times begin to slip. Responsiveness slows.

Individually, these signals are easy to overlook. Together, they point to emerging instability. By the time disruptions impact production or inbound flows, the problem is already established.

Seeing the Signals Earlier

Early signs of supplier risk often appear in patterns rather than events. Shipment timing drifts, confirmations take longer, and quality deviations increase subtly.

Without visibility into these changes, planning continues under the assumption that everything is stable.

predictive supply reliability

A Predictive Layer for Upstream Stability

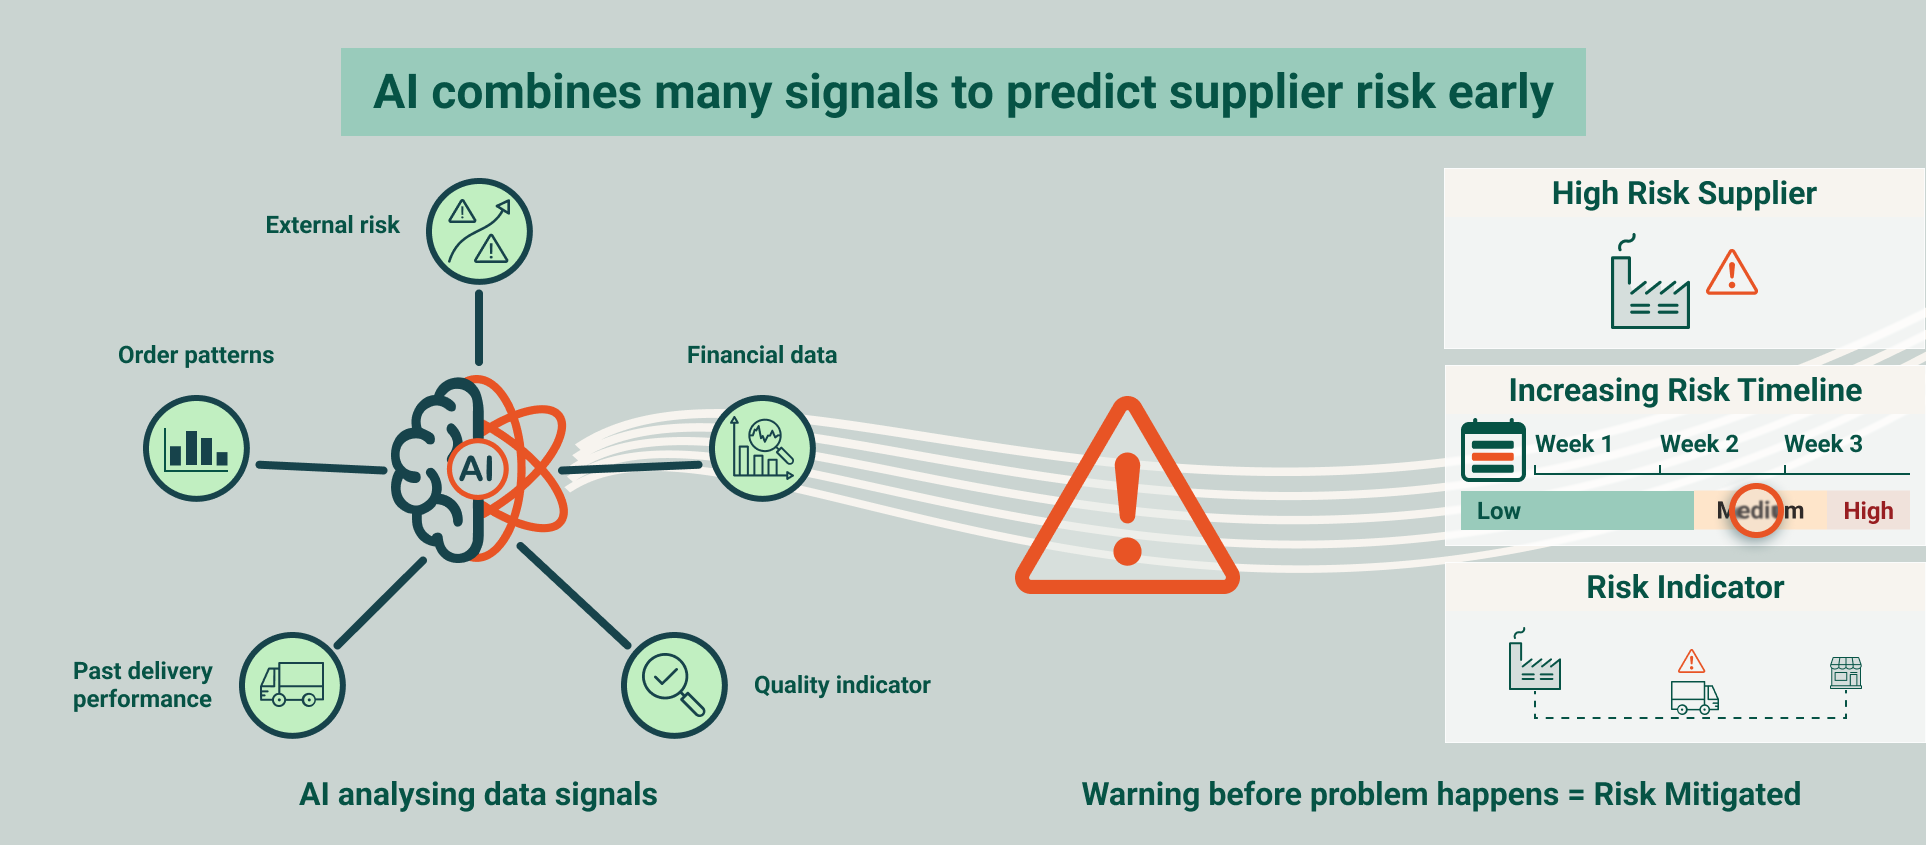
Predictive models connect signals across supplier behavior to identify where performance is likely to deteriorate.

They evaluate how delivery patterns evolve, detect when normal variation becomes risk, and highlight changes in responsiveness, capacity, and quality.

Key risk indicators include:

  • Delivery behavior drifting from established patterns
  • Capacity signals indicating upcoming constraints
  • Gradual changes in quality performance
  • Slower response cycles from suppliers


This creates a forward-looking view of supplier reliability.

predictive supply reliability

Turning Insight into Action

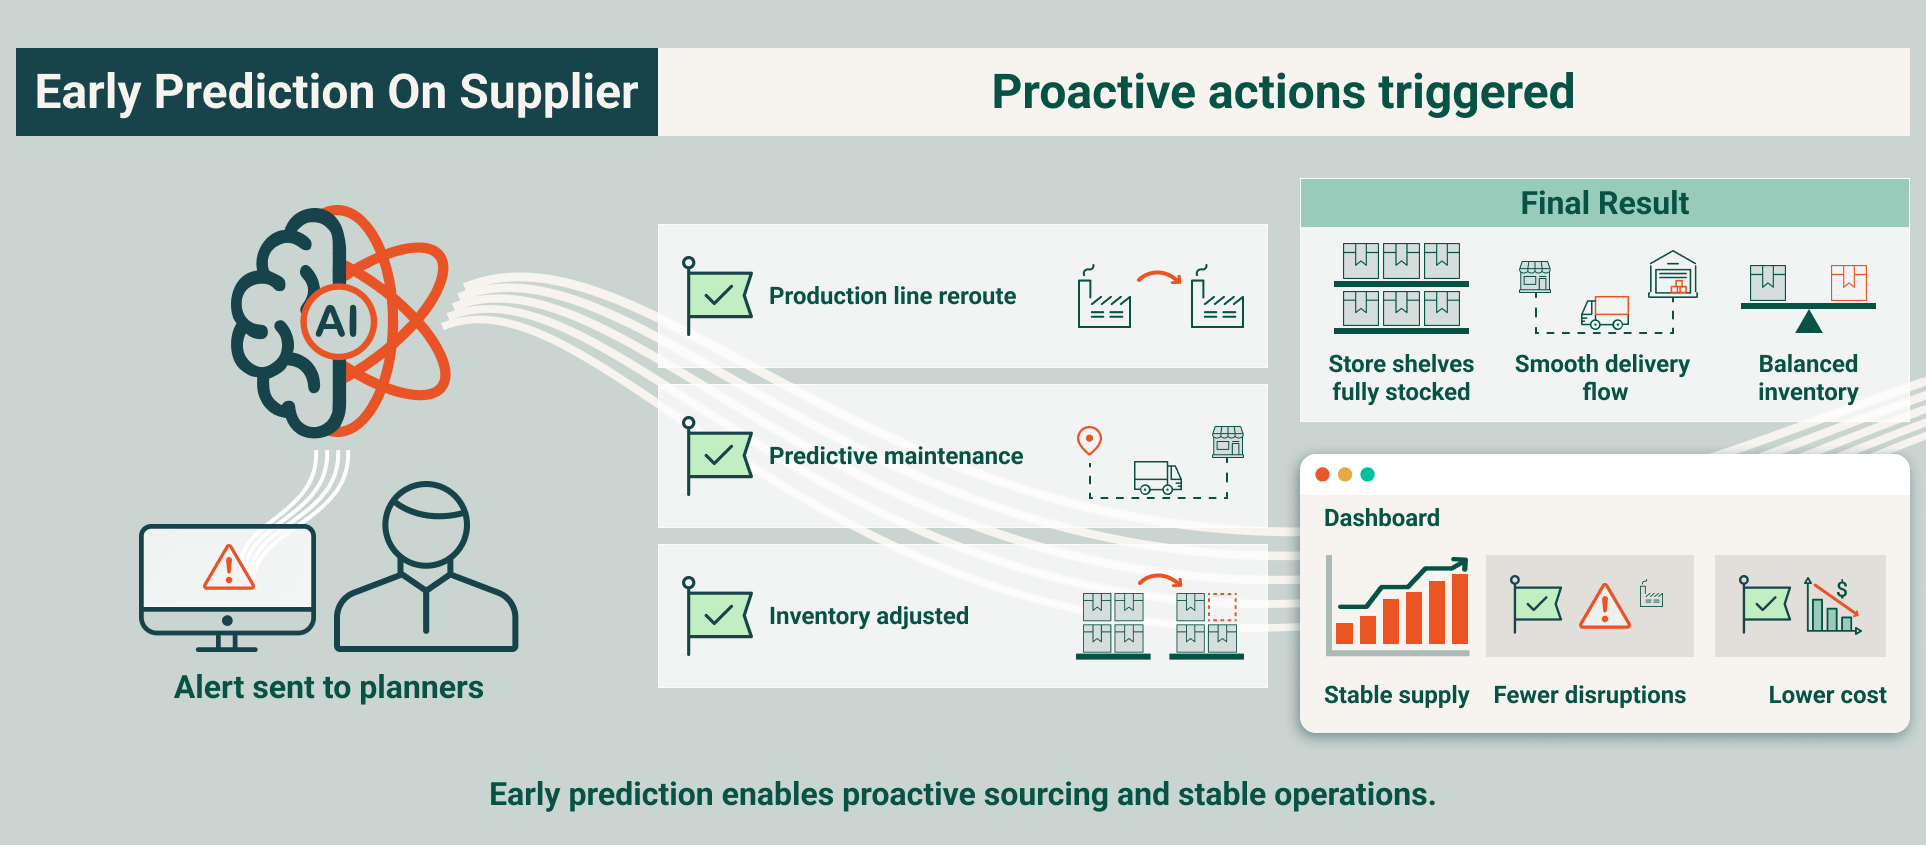
With earlier visibility, teams can act before disruptions escalate. Sourcing decisions become more targeted, safety stock is applied where it matters, and logistics gains time to adjust routing or timing. Instead of reacting to problems, organizations begin shaping outcomes.

Stronger Alignment Across Functions

Predictive visibility creates a shared understanding of risk. Production, procurement, logistics, and commercial teams operate from the same picture, reducing last-minute adjustments and improving coordination. Decisions become more aligned, and execution becomes more stable.

predictive supply reliability

Measurable Impact

  • Earlier identification of supplier risk
  • More targeted sourcing and mitigation actions
  • Fewer expedites and emergency interventions
  • More stable and predictable inbound flows

A Capability That Improves Over Time

As more supplier data is processed, predictions become increasingly precise. The system adapts to changing behaviors across regions and categories, strengthening resilience across the entire supply base.

Want to learn more?

With 20 + years of experience and more than 1,000 successful projects, Optilon helps companies design supply chains that work and keep improving.

Book a meeting with a supply chain expert to explore how predictive supply reliability can reduce risk, improve supplier performance, and strengthen upstream stability.

Production rarely unfolds exactly as planned. Machines fail, materials arrive late, quality issues emerge, and staff availability shifts. These disruptions create gaps between planned and actual output.

In many organizations, these issues are only identified once they are already affecting production. At that point, planning teams have limited options and are forced into reactive adjustments.

The cost of reacting too late

Without early visibility, small deviations quickly escalate into operational inefficiencies. Rescheduling becomes urgent, overtime increases, and unnecessary changeovers occur. Capacity is either underutilized or overstretched, while delivery precision declines and costs rise.

Over time, confidence in planning decreases, and teams rely more on manual intervention to maintain control.

Production outcome detection

From reactive response to predictive control

Production outcome detection introduces a predictive layer that identifies where deviations are likely to occur before they impact output.

By combining historical performance with real-time signals, the system highlights risks early. This allows teams to adjust schedules, reallocate resources, and protect priority orders in a controlled way. Instead of reacting to disruptions, organizations gain the ability to anticipate and manage them.

What signals reveal emerging risks

The system evaluates a wide range of production data to detect early signs of instability.

Key signals include:

  • Cycle times, throughput patterns, and scrap rates that indicate performance shifts
  • Sensor readings and energy profiles that highlight emerging equipment risks
  • Material availability and delivery signals that reveal potential constraints
  • External factors such as upstream disruptions and workforce limitations

By combining these inputs, the system estimates both the likelihood and potential impact of future deviations.

Turning predictions into operational decisions

Predictive insights are embedded directly into planning and execution processes. Planners can adjust schedules earlier, supervisors gain visibility into where action is needed, and maintenance teams can prioritize high-risk equipment. Leaders gain a clearer view of expected production stability before planning cycles begin.

This improves alignment between planning and operations and reduces the need for last-minute interventions.

Production outcome detection

Strengthening cross-functional coordination

Earlier visibility into production risks improves coordination across functions. Procurement can prepare for material changes, logistics can adjust outbound expectations, and customer-facing teams can communicate more accurately. Scenario planning also becomes more realistic by incorporating predicted variability instead of relying only on historical assumptions.

Production outcome detection

Measurable Impact

  • Earlier identification of production risks before they impact output
  • Improved delivery performance through timely schedule adjustments
  • Reduced downtime and scrap by addressing issues early
  • Lower operational costs by reducing emergency actions and expedites

Want to learn more?

With 20 + years of experience and more than 1,000 successful projects, Optilon helps companies design supply chains that work and keep improving.

Book a meeting with a supply chain expert to explore how AI-driven production outcome detection can help you stabilize operations, protect customer commitments, and optimize resource use across your production network.

Data problems rarely appear all at once. A missing value. A duplicated record. A misaligned unit.

Individually, these issues seem minor. Over time, they accumulate, quietly shaping forecasts, replenishment logic, and planning decisions. By the time they are discovered, the impact is already embedded in the system.

The Hidden Cost of Imperfect Data

Small inconsistencies create disproportionate effects. A missing attribute can redirect material flows. A duplicated entry can distort sourcing decisions.

Planners begin questioning outputs. Analysts spend time rebuilding datasets. Manual corrections increase, often introducing new variation. What starts as a data issue becomes an operational one.

Automatic data correction

From Periodic Cleanup to Continuous Correction

Instead of relying on manual review cycles, machine learning enables continuous data correction. The system evaluates data as it moves through the supply chain, learning how products, suppliers, and locations behave. It identifies deviations from expected patterns and determines whether they represent acceptable variation or actual errors.
When needed, corrections are proposed or applied automatically, keeping data aligned without interrupting workflows.

What the System Detects and Corrects

  • Missing fields reconstructed through learned patterns
  • Duplicate records identified through similarity detection
  • Conflicting master data resolved through inferred logic
  • Misaligned units or attributes corrected using validated references
    Each correction remains traceable, ensuring transparency and control.


Automatic data correction

Embedding quality directly into daily planning

With stable data in place, planning starts from a position of confidence. Forecasting and replenishment engines operate with less noise, and teams spend less time validating inputs. Master data efforts shift from fixing recurring issues to addressing root causes.

Measurable Impact

  • More stable and predictable planning outcomes
  • Reduced manual data cleansing effort
  • Fewer disruptions caused by incorrect inputs
  • A scalable approach that improves as data volumes grow
    5–15% lower inventory
     

Continuous Learning, Lasting Value

As the system processes more data, it continuously refines its understanding of what “correct” looks like. Data quality stops being a recurring problem and becomes a long-term performance enabler.

Want to learn more?

With 20 + years of experience and more than 1,000 successful projects, Optilon helps companies design supply chains that work and keep improving.

Book a meeting with a supply chain expert to explore how automated data correction can improve data quality, reduce manual effort, and strengthen your planning foundation. 

Culinar has taken a decisive step forward in demand planning — bringing forecast reviews, promotion planning, KPI follow-up, and market signals into one shared platform with Optilon Collaboration. The result: a more proactive planning process, stronger promotion visibility, and a scalable foundation for broader stakeholder involvement as the business grows. 

About Culinar

Culinar, part of the Lyckeby Group, is a Swedish food company specialising in flavour and texture solutions for customers across the food industry, retail, and foodservice markets in Europe. The company’s broad portfolio includes the well-known consumer brand Kockens Kryddor — a product range with significant promotional complexity and seasonally driven demand patterns that make accurate, collaborative forecasting especially important. 

“What makes the biggest difference is that we now have a structured way to capture promotion inputs, customer signals, and market changes in one place. It allows us to turn more information into actionable forecast decisions, while creating a process that can grow together with the business and support broader alignment over time.”

CHALLENGE

Turning demand signals into better decisions

With Optilon Collaboration, Culinar’s demand planners now work in a shared environment where forecast updates, KPI follow-up, and market intelligence come together. Using Forecast Review, Demand Summary, and Forecast Accuracy modules, the team can quickly adjust demand signals, monitor performance, and focus on the changes that matter most. 

The impact has been tangible. Planners report spending significantly less time on administrative follow-up, with more capacity directed toward interpreting market signals and acting on them. Forecast accuracy tracking is now continuous rather than retrospective, giving the team earlier warning of deviations and reducing the risk of costly over- or under-supply. 

SOLUTION

Structured promotion planning and market visibility

A key improvement has been the ability to manage promotion-driven demand in a more structured and auditable way. With reseller promotions from large retail customers, Culinar can now translate promotional uplift into clear demand assumptions and align buying decisions earlier in the process — reducing the lag between a promotion decision and its reflection in the supply plan. 

At the same time, market changes can be documented directly in the platform and translated into long-term forecast adjustments, making it easier to respond proactively to demand shifts rather than reacting after the fact. 

“The biggest difference is the overview. We can move faster in the planning process and spend more time understanding the market signals that actually improve the forecast. That helps us focus less on administration and more on making better decisions together.”

RESULT

A foundation for the S&OP journey ahead

Beyond improving day-to-day forecasting, Optilon Collaboration gives Culinar a platform to mature with. As Culinar’s S&OP process continues to develop, shared KPIs, meaningful performance graphs, and a single common demand view make it straightforward to involve stakeholders across buying, sales, and finance in a structured way. 

The platform creates the conditions for faster, better-informed decisions at the cross-functional level — supporting a continuous improvement cycle rather than periodic alignment efforts. For a company with Culinar’s growth ambitions and portfolio complexity, that scalability is as important as the day-one efficiency gains. 

Struggling with supply chain complexity? Let’s talk.

With a track record of over 1,000 successfully completed projects and 20+ years’ experience, Optilon is your trusted supply chain partner. Book a meetingwith a supply chain expert to explore how Optilon Collaboration can help your business make better decisions. 

Lead times change constantly. Suppliers shift. Transport conditions fluctuate. Production schedules move. Yet many organizations still rely on averages or outdated assumptions. 

Over time, those drift away from reality, introducing uncertainty into planning, inventory, and service. The solution starts by recognizing where traditional approaches fall short and replacing them with a data-driven method that reflects how your supply chain actually behaves. 

Why traditional lead time assumptions fall short 

Even when lead times exist in the system, they rarely reflect how the supply chain actually performs. Variability increases quietly, and teams compensate manually. 

Buffers grow. Procurement reacts too late. Logistics loses visibility. Costs rise while service levels become harder to protect. This is the gap a more dynamic, machine learning approach is designed to close. 

How machine learning improves accuracy 

Machine learning continuously evaluates how lead times behave in practice. It connects patterns across shipments, suppliers, and transport flows to estimate when orders are actually likely to arrive. 

Key data inputs include: 

  • Historical shipments 
  • Supplier reliability patterns 
  • Seasonal effects 
  • Transport performance 
  • Event-based disruption 

As new data flows in, predictions update automatically, creating a live view of lead time behavior instead of a fixed assumption. 

Better decisions across the supply chain 

With more accurate timing, planning becomes more precise. Safety stock is set with confidence instead of caution, procurement can act earlier, and logistics teams gain time to adjust before delays escalate. These decisions reinforce one another, shifting operations from reactive firefighting to proactive control.  

Measurable Impact: 

  • 5–15% lower inventory 
  • 10–30% fewer stockouts 
  • 20–40% less expedited freight 
  • 2–5 percentage points higher service levels 

In some cases, organizations have doubled lead time accuracy using predictive modeling. 

Predictive lead times integrate into existing processes without disruption. They continuously improve as new data flows in, turning variability into predictability.

experts and tribal knowledge 

Want to learn more?

With 20 + years of experience and more than 1,000 successful projects, Optilon helps companies design supply chains that work – and keep improving.

Book a meeting with a supply chain expert to explore how Optilon’s AI-powered demand sensing solutions can help you respond faster to market signals, improve forecast accuracy, and keep inventory aligned with real demand. 

Contact us to book a meeting

By clicking “Submit”, I agree to Optilons privacy policy.