I remember being a fresh student, 17 years old at my High school’s newly introduced cooperation with a global German company with its Nordic headquarters in my birth town just north of Stockholm. It was a unique chance to study subjects once a week that were set to plant the seed for us students to pursuit a career within the technology field, and perhaps one day, an employment at this specific company. One of the courses that made an impression was the Project Management course. The first day we learned that a Project Manager is responsible for everything in a project. He or she could never blame downwards on the team members. Essentially, he or she was not just the accountable, but also in a way responsible for the work of each team member. Now coming from this type of doctrine, which I did not reflect upon very much at the time, and given that it was a German company, it is very different from what we are used to in Nordic originated companies.

During some of my first employments after finishing university, I got to experience this difference right from the start. In comparison to what I had previously been taught at the German company, many project managers seemed to be less authoritative and often had a very consensus-based leadership style. Although intuitively it might seem like a negative feature, this leadership style is not always bad. From my own point of view, I felt that the responsibility for being creative and taking initiatives was shared with all project team members, including the Project Manager. This created one of the pros. The biggest con on the other hand, was that sometimes this shared responsibility could create a vacuum in responsibility as there was a lack of understanding of what was expected from each team member. In some projects it felt like I together with my team members were driving, planning, executing, and overseeing the project, even though none of us at the time were the Project Manager. We had become both responsible for the work that was to be executed, as well as accountable for the outcome of the project. Something that would never have been accepted in the German company.

So that brings a question: how can we fully use the power of a consensus-based leadership style with its pros, without having to deal with the cons?

A few years back, to improve Optilon’s delivery model, we nailed down the culprit of the matter. We discovered it was the lack of guidelines describing what the responsibilities of each team member (including Project Manager and Account Manager) really was. The answer to the above question became the following: Define a Responsibility map. A responsibility map clearly states who is responsible for what, regardless of project or role in the team. To aid every project team we created a template of the responsibility map to be used as a standard tool in each delivery.

To make things clearer, we also decided to introduce the word Accountability into this template as a complement to the word Responsible. Since both Accountable and Responsible translates to the same word “Ansvar” in Swedish, the importance of accountability risked being left out.

The result: we combined the best things from two worlds. We now have a hybrid by combining the way of the German company and the Nordic consensus-based way. Now each project has a clearly defined picture of the responsibilities and accountabilities of each project member. Not all team members will have accountability, but in larger projects some will. Although never directly to the client, but to the Project Manager who in turn has it to the client. This means that team members will never have to find themselves acting as an interim or substitute Project Manager, and in instances of project uncertainties it will all travel in one direction – up-streams to the Project Manager.

We can see that this approach has helped us streamline our projects to be more consistent in planning and execution. This assures a higher success rate when helping our clients with all their different Supply Chain endeavors.
At Optilon we believe, that the next generation of Supply Chain competitive advantages will come from Artificial Intelligence (AI). We believe that it is necessary to have a platform that automates and empowers organizations to embrace the AI journey on their own. Optilons AI solutions are designed to solve existing Supply Chain challenges without the need for deep experience or knowledge of AI. Therefore, we have collated this Supply Chain AI Kit to get companies started on their AI journey.

Getting started with the journey
Many companies are still struggling to get the journey started. To get you off for a good start you might want to have a look at the whitepaper we created on AI. You should read the whitepaper if you would like a general understanding of what AI is, how it could benefit your business and how it can be implemented in your Supply Chain.
You can download the whitepaper right here: Turn your Supply Chain into a competitive advantage with AI (whitepaper).

From a business perspective we have in this blogpost highlighted why Supply Chain AI improves competitiveness (blog)

If you want a quick introduction to how to get the journey started then read this blogpost – 5 steps to get started with AI in the Supply Chain (blog)

We have also recorded a session – how to get started with AI in the Supply Chain (webinar) 

Explore your Supply Chain data with AI
If you want to explore more of your data, and you are still uncertain about what kind of business value you would be able to create, then you can find some inspiration in the following webinars.

How can you drive out more value of your data with AI

Utilizing AI to drive insights

Deep Dives – more detailed cases
We have a group of Nordic companies who have already embarked on the journey and with whom we have gathered some experience. We have started sharing that experience and cases in a series of “Deep Dive” webinars.

In this session we explored how companies can get a higher customer satisfaction by using AI to monitor supplier reliability:

ABC inventory classification has been around so long that most planners just assume it’s the only way to segment inventory. In fact, it’s not. And it’s not even nearly the best way. It’s actually a throwback from technology developed during the 1960s that hasn’t responded to the orders of magnitude increase in computer power that has enabled far better ways of solving the problem.
In this blogpost we will look into a more detailed explanation of why ABC inventory classification is old school and look at what true inventory optimization in 2021 looks like.

Understanding the basics of ABC inventory classification
To understand the shortcomings of ABC inventory classification, we need to understand how it is done. Nearly all traditional inventory management applications calculate safety stock for each individual SKU-Location combination. This requires identifying the desired service level % for each SKU-Location.

ABC Inventory classification

Since most companies have tens of thousands, hundreds of thousands, or even millions of combinations, it’s impossible to identify a service level for every individual SKU-Location. So a simplification is necessary and ABC classification is one way of doing it. A common method is a 3×3 matrix with the cost value on the Y axis and order-lines on the X axis, a so called “double” ABC classification.

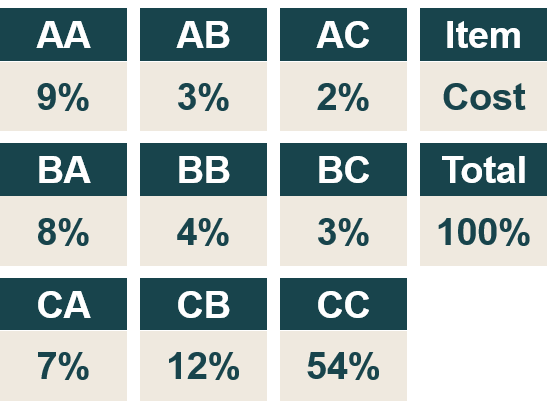
The percent distribution between classes is often based on 80% of the cost value in the A items, 15% in the B items and 5% in the C items. The same 80/15/5 breakdown is applied to the number of order-lines. Because just a few items can generate so many order-lines and cost of sales, it usually only takes a few A items to reach the 80% thresholds. Therefore, the end result is a matrix with a very small share classified as AA and a majority classified as CC.

A ”trial & error” process is then used to allocate a desired service level to each ABC class. The AA class is often given the highest service level and the CC class the lowest. The aggregated service level is calculated and might end up at 94% in the first try, which might not fit the company’s overall goal, such as 95%. To reach the 95% goal, iterative attempts are made using higher service levels for one or several classes (and perhaps reducing some). The new distribution might turn into an aggregated service level of 95.5%. A small buffer (0.5% in this case) is often good, and the service levels for each class are confirmed.

From here, all of the items (or articles) in each ABC class are assigned the same service level target. If we have 10,000 items in stock, then 5400 in the CC class will be assigned the same service level target. Then the safety stock levels are calculated which results in a total inventory investment.

The pitfalls of ABC Inventory classification
Let us think about this for a moment. Inventory investment is a consequence of each ABC classes’ service level. Could we have chosen other service levels for the classes and still reach 95.5%? Of course! There are a large number of combinations that could result yield the same result.

How do we then know that the distribution we chose is the most optimal one, achieving a minimum stock investment? The answer is that we don’t know. That is why this method is called ”inventory management” rather than ”inventory optimization”.

Supply Chains are complex, with several connected echelons such as central, regional and local inventories. Also some traditional inventory management software offer an 8×8 ABC matrix per location. The workload to define and continuously maintain these matrices becomes very intense. And, as we said, we don’t know whether or not we have an optimal distribution.

What “best in class” inventory Segmentation looks like today
Is there another way to address safety stock computing in 2021? The answer is, of course, yes. A more modern approach exists.

Traditional ABC classification is based on an operational or logistics perspective. There is rarely any connection to sales and marketing or the companies’ customer needs.

Inventory optimization instead looks at the product range and the business. This difference is possible thanks to the use of “service class”. Examples of service classes can be ”accessories”, ”items with a high margin”, ”own-brands”, ”high end brands”, ”critical spare parts”, to name a few. This type of categorization is much more relevant to sales and marketing, who often have very little or no understanding of ABC classification. Every service classification contains items from several ABC classifications (according to the old method) which is irrelevant to true inventory optimization.

Just as in traditional inventory management, aggregated service level goals are also defined in inventory optimization, but per service class instead of ABC class. What happens in the following steps is very different from traditional inventory management. By using ”stock-to-service” curves, the software optimizes every single service level and safety stock level of the SKU-Location, which is also known as mix optimization.

The aggregated service class goal is achieved with a stock investment as low as possible. Instead of inventory planning with ABC classes, every SKU-Location gets a service level to calculate safety stock levels. The inventory optimization software automatically calculates a service level for every SKU-Location that aggregates to the total service level target for the overall service class, achieving “service level optimization“.

True inventory optimization uses “stock-to-service”
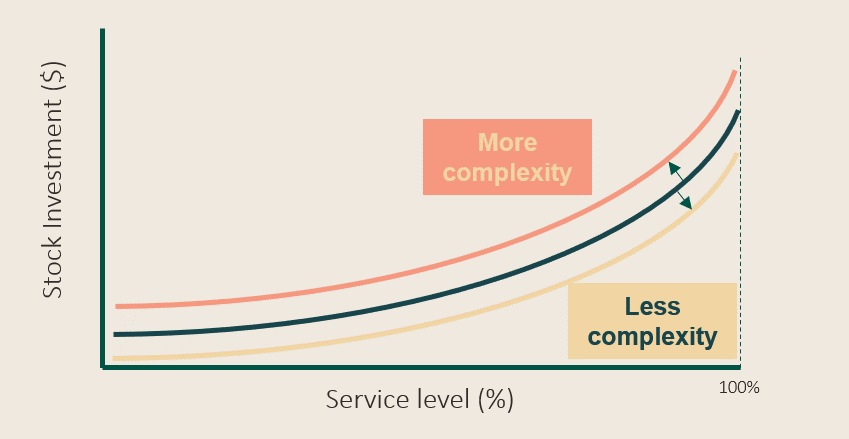
True inventory optimization models every SKU-Location and summarizes it in a ”stock-to-service” efficient frontier, where the relationship between service level and stock investment are defined. If demand variation or lead time increases, the stock investment (or complexity) must be increased in order to keep the same service level and vice versa.

ABC Inventory classification

The result is that every single item in every single location (SKU-Location) is an individual and is analysed and managed as such. In a sense, there can be as many ABC classifications as there are SKU-Location combinations.

This statement is impossible to fit into traditional inventory management and so it is a very challenging one to accept. If every SKU-Location combination was described with dozens of variables (demand variation, standard cost, my order quantity, multiple order quantity, run-out time, lead time, variation in lead time, sustainability, and more), it would unmanageable, instead of just one or two dimensions, as in a traditional ABC classification matrix.

By the way, it’s important to point out that the automated differentiation of service levels in each service class can be set within defined limits. As an example, the aggregated service level goal for “accessories” could be 93% with a lower limit of 89%. The inventory optimization can then subscribe any service level from 89% and above in a way that the stock investment is minimized. For example, “critical spare parts” could have a goal of 99.5% with a lower limit of 99.3%. Reducing the degrees of freedom in each service class (or increasing number of service classes) will lessen the potential of inventory reduction, since competition is reduced. But these reductions in freedom are not critical as long as they aligns with company strategies and customer demands.

Truly modern inventory optimization enables a whole new level of automation of large complex supply chains with hundreds of thousands of SKU-Location combinations where service levels can be guaranteed over time with a minimum of stock investment.

Business leaders often have to balance strategic goals for cost reduction, sustainability and customer satisfaction, while at the same time maintain an operationally healthy and efficient product distribution network. The lack of tools that help create a digital overview of the operational network further complicates this. It often results in silo thinking as well as static and ad-hoc route configurations and decisions.

Imagine that you are a manufacturing company that needs to distribute your products to end users or distributors, both nationally and internationally. So how should the item travel through the network? How should the policies regarding the use of 3rd party transport suppliers be put together? How is this carried out in the most sustainable and cost effective way?

Why is Artificial Intelligence / Statistical Modelling a Good Idea?
We see that using Artificial Intelligence/statistical modelling can create real business results. In the cases we have worked with so far, we have shown a potential of 4% in annual transport costs by using a share of the recommended routes. 23% of the new routes simulated had not historically been used before. This resulted in an estimated 1% reduction in annual CO2 emissions (when CO2 was weighted by 30% of the score). At the same time, this enabled a 360-degree full visualization of the entire network, which was the data basis for the analysis and the models.

The journey
Our network & route evaluation solution (or NRE for short) uses a combination of statistical and machine learning models to identify and recommend routes. They are maximized up against weighted costs, CO2 emissions and different types of customer scores. Via Optilon´’s web interface, the company’s employees who work with the optimization, are given several route alternatives to choose from and recommended actions.

A combination of statistical modeling and machine learning algorithms analyzes large combinations of existing “legs” in either existing or new routes and compares with historically used routes.

NRE not only helps with recommendations for routes, but it also provides a digital overview of the overall network. It can be at customer or order data level, transport waybill, data about the “leg” and last-mile data image.

The solution
Access to NRE can be provided via the Optilon web interface. Here, the company employees can easily evaluate, benchmark and approve/reject route recommendations.

Approved routes can be used via data integration in operational routing applications, while at the same time being monitored at a tactical and strategic level via interactive aggregated reports, either via the Internet or third-party BI apps.

.

An increased production complexity made The Absolut Company look for a better and more efficient way to manage the production of the most exported food and beverage product in Sweden. With the purchase of the company from the Swedish government in 2008, Pernod Ricard initiated a transformation of the brand. This had a large impact on the manufacturing process.

The Challenge
For five years, the number of SKU’s rose by 19% as the number of core flavors increased from 11 to 18 and the number of limited editions went from 2 to 12, an increase by 600%. In contrast to the highly automated production process, production planning process was a manual task. Forecasting and production planning was performed by only one planner, with the help of spreadsheets. But as complexity rose, a change was necessary, and The Absolut Company started to look at alternative set-ups.

Peter Neiderud, Director Supply Chain and QE, understood that this was a major project, necessary in order to move to a new era of Absolut Vodka while honoring traditions and continuing the manufacturing in Åhus.

Summing up:

  • Increased production complexity
  • Limited resources for planning tasks
  • Pressure to secure availability towards the Pernod Ricard market companies
  • A need to ensure lean principles in production, minimizing environmental impact

The Journey
The Absolut Company chose Optilon as a partner after a thorough evaluation of several candidates. A key factor was Optilon’s ability to integrate best-of-breed solutions for production planning, demand forecasting, inventory optimization, and replenishment into a seamless process. Along with this, a key criterion for a new way of working was the ability to automate business processes.

Also, The Absolut Company had clear targets regarding service levels towards its parent company. Optilon proposed a solution that can guarantee product availability according to targets, with minimal investments in finished goods.

“Quality is paramount for us, especially when it comes to production as we leave nothing to chance. We have carried out a thorough evaluation of alternatives and view Optilon as an exceptional solution provider when it comes to improving our logistics and production processes.”

Peter Neiderud, Director Supply Chain and QE, The Absolut Company

The Results
Through a high level of automation in planning, proactive decision making, and optimized production sequences, challenges were resolved.

Summing up on results:

  • Optimized production sequences
  • Increased overall production efficiency
  • Increased product availability
  • Highly automated end-to-end processes

With an increasing demand for product availability, especially in the omnichannel, keeping the inventory levels low while keeping a stable service level becomes increasingly challenging. Especially in an industry that is service-oriented, one does not want to put too many hours into managing the inventory that could be used for customer service instead. Kronans Apotek decided to tackle the problem by centralizing and automating their inventory management by working with Optilon and implementing SO99+. This resulted in reduced inventory levels, increased service levels, and more time for the staff to spend with customers.

The Challenge
With over 330 pharmacies, Kronans Apotek is the third-largest pharmacy chain in Sweden. Kronans Apotek has approximately 27 000 items in total and around 4 million locations/SKU combinations. The customers value the right product range; at the same time, it is also time-consuming and challenging for the pharmacy staff to plan the correct assortment and availability, resulting in high inventory levels.

The inventory management had become too decentralized and Kronans could not properly manage varying seasonal patterns, frequent product replacements, and new pharmacy launches. The inventory levels were high and Kronans wanted to decrease them by 15% while increasing the service level by 1.5 %. At the same time, they wanted the inventory optimization to be less time requiring and centralized to give their staff more time to spend on giving service and advice to customers.

Summing up on the challenges:

  • Too high inventory levels
  • Inventory management process too decentralized and and time consuming
  • Higher customer expectations on product availability

The Journey
Each pharmacy used to have a designated inventory manager who was responsible for manually setting order parameters for each item; a time-consuming job that never led to optimal inventory levels. With the objective to reduce inventory, increase service, and release time for the staff to spend with customers, Kronans Apotek made the decision to centralize all product sourcing.

The central organization then needed a suitable application to support forecasting and inventory optimization. After a thorough evaluation of alternatives, Kronans Apotek chose Optilon’s solution based on SO99+ (Service Optimizer 99+) from ToolsGroup, with support from consultants at Optilon.

“We chose Optilon’s inventory optimization since they work from the customer’s requirements, while being a developer independent solution provider. In addition, consultants from Optilon supported the organization throughout the whole implementation process” says Tina Jalap, Supply Chain Manager at Kronans Apotek.

The Results
“A few months into the implementation we saw a decrease in the inventory of prescription-based items by approximately 15 percent, specifically for the pharmacies where we had implemented the inventory optimization solution.” Says Jalap.

A key driver for the selection and implementation of a new solution was to drive automation of the supply chain process as far as possible. As a result, Kronans Apotek calculates optimal replenishment and inventory parameters for SKUs in all of the pharmacies on a daily basis, in an automated process. Four people work centrally to supply products to Kronans’ 320 locations, instead of staff at every pharmacy. This saved time by a total of 24 full time employees across the retail stores. Inventory parameters are based on a forecast that automatically considers seasonality, marketing campaigns and planograms (store and shelf layout). Industry-specific considerations like “product of the season” (a government mandated practice for pharmacies in Sweden), is also catered for. All in all, Kronans Apotek has transformed their organization and planning process from push oriented to one that is truly demand-driven.

Kronans not only centralized inventory management—it established core, efficient supply chain planning with the agility to adapt to business change. For example, the pharmacy chain uses SO99+ for promotional campaigns; during the campaign, products are supplied through a temporary increase in parameters. “This increase is removed 10 days before the campaign ends, allowing the volumes to sell down; SO99+ then excludes the temporary increase from future forecasts,” Jalap says. “The software also ‘learns’ from previous campaigns, as well as from customer patterns and seasonal variations.”

Summing up on results:

  • Reduced inventory levels by 15% withn a few months
  • Service levels increased by 1%
  • A highly automated and centralized process
  • Efficient handling of promotional campaigns seasonality

Contact us to book a meeting

By clicking “Submit”, I agree to Optilons privacy policy.